

 About Us
You can expose the
dashboard server in another address using the HOST environment variable./your/local/dir/prowler-output to match the path that contains your prowler output.
Remember that the
dashboard server is not authenticated. If you expose it to the Internet, do it at your own risk.
Overview Page
The overview page provides a full impression of your findings obtained from Prowler: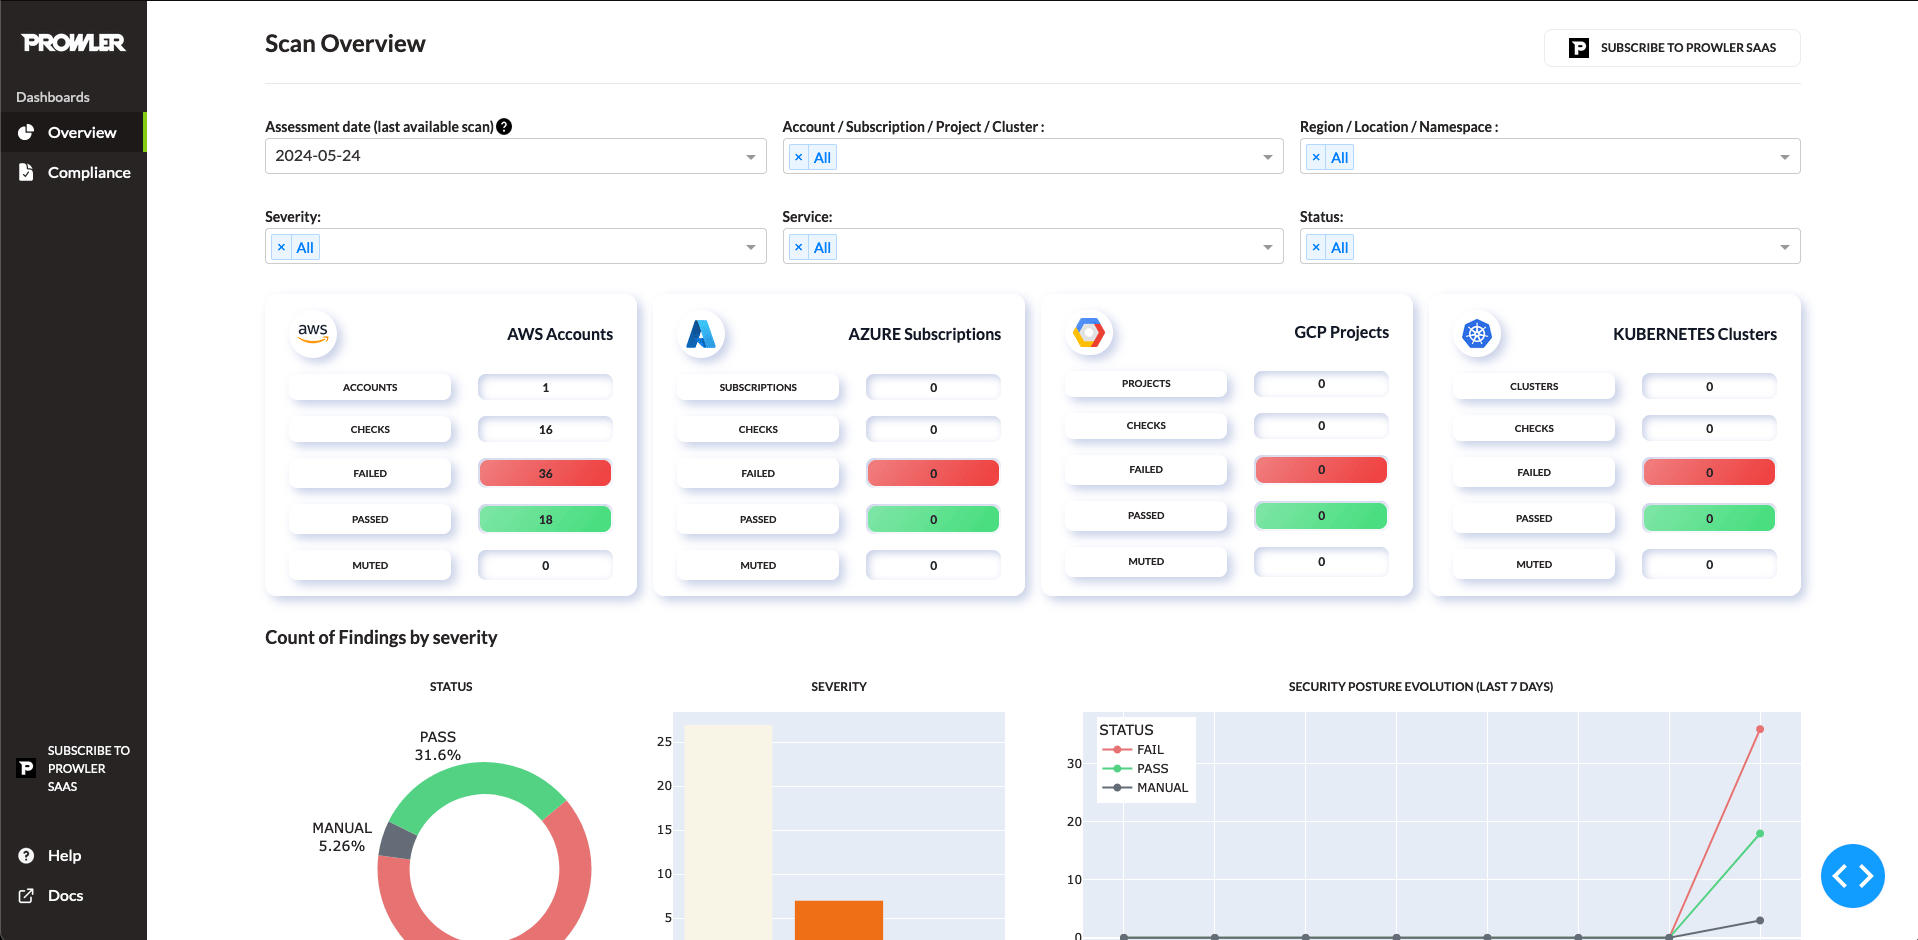
-
Apply filters:
- Assesment Date
- Account
- Region
- Severity
- Service
- Provider
- Status
- Category
-
See which files has been scanned to generate the dashboard by placing your mouse on the
?icon:
-
Download the
Top Findings by Severitytable using the buttonDOWNLOAD THIS TABLE AS CSVorDOWNLOAD THIS TABLE AS XLSX - Click the provider cards to filter by provider.
-
On the dropdowns under
Top Findings by Severityyou can apply multiple sorts to see the information, also you will get a detailed view of each finding using the dropdowns: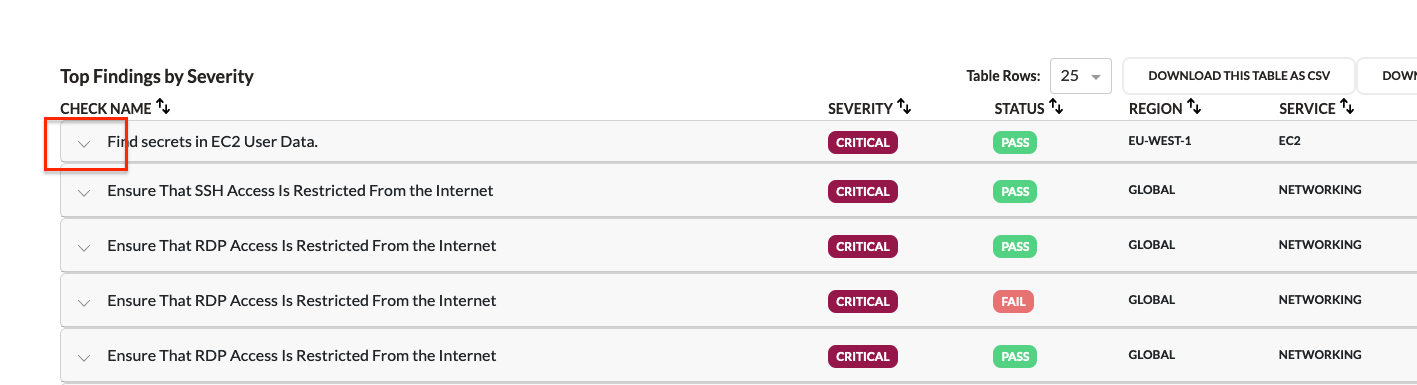
Compliance Page
This page shows all the info related to the compliance selected. Multiple filters can be selected as per your preferences.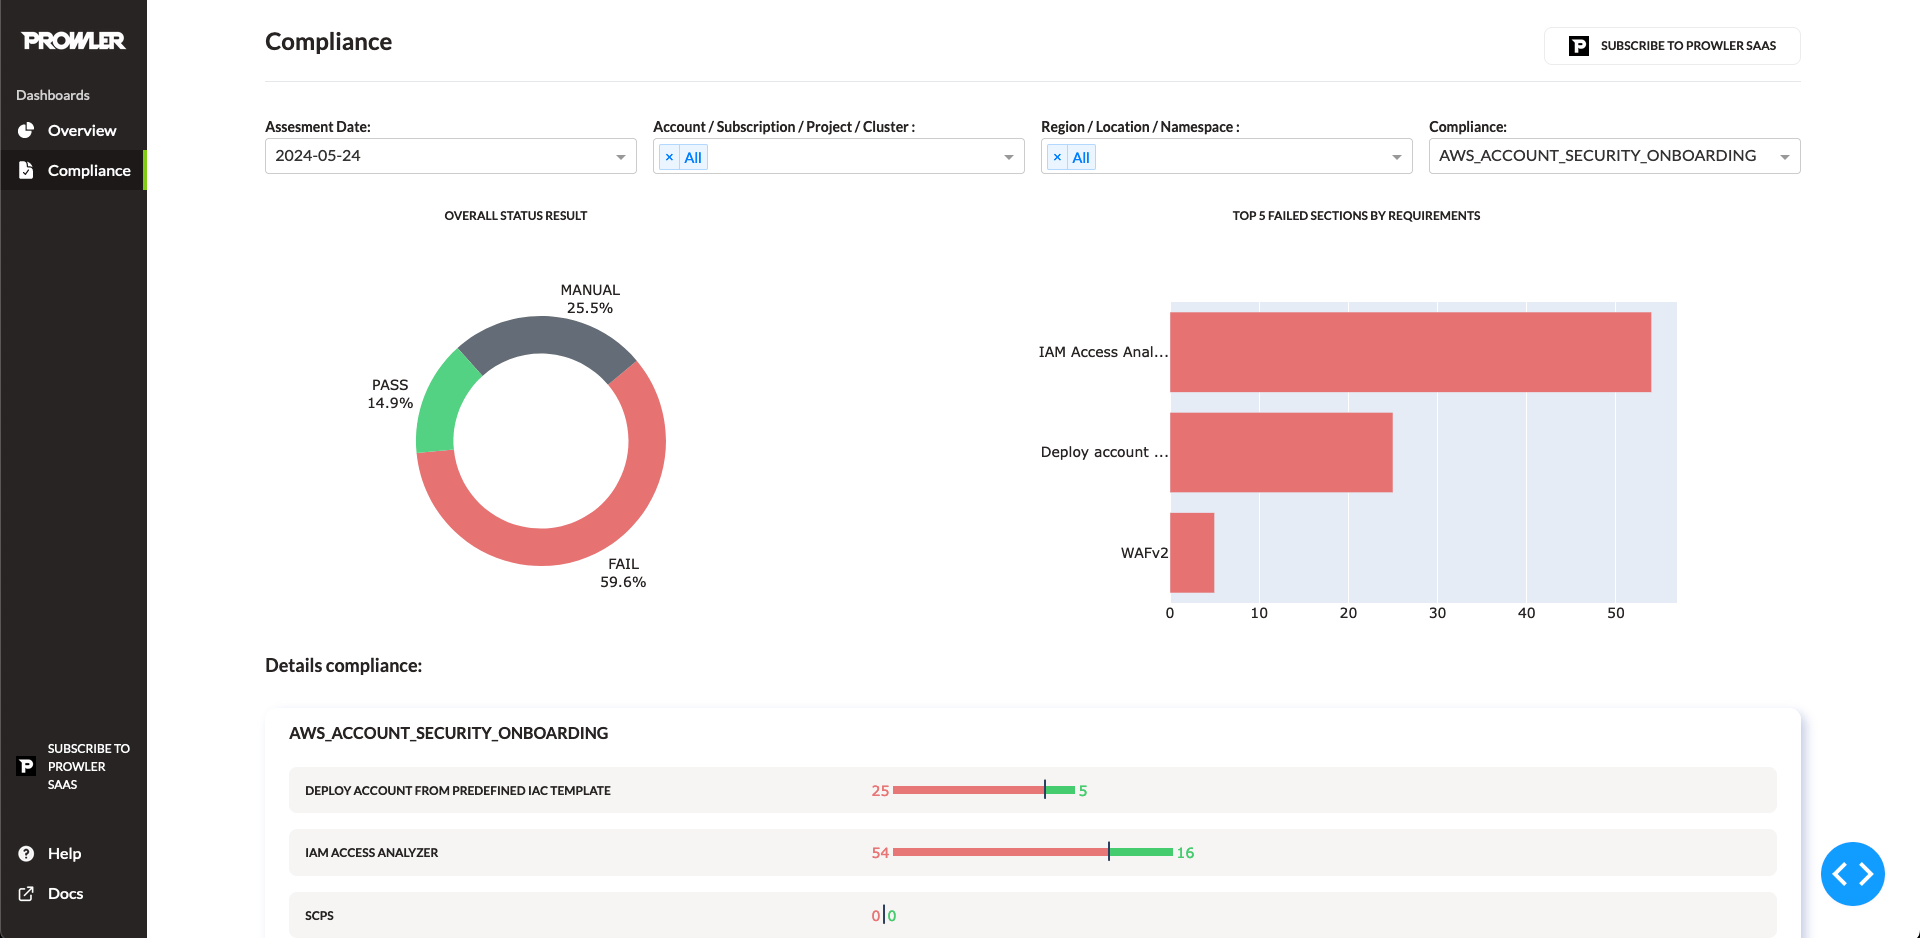
_ instead of .) to the path /dashboard/compliance.
In this file use the format present in the others compliance files to create the table. Example for CIS 2.0:
S3 Integration
If you are using Prowler Cloud with the S3 integration or that integration from Prowler CLI and you want to use your data from your S3 bucket, you can run the following command in order to load the dashboard with the new files:Output Path
Prowler will use the outputs from the folder/output (for common prowler outputs) and /output/compliance (for prowler compliance outputs) to generate the dashboard.
To change the path, modify the values folder_path_overview or folder_path_compliance from /dashboard/config.py
If you have any issue related with dashboards, check that the output path where the dashboard is getting the outputs is correct.