

 About Us
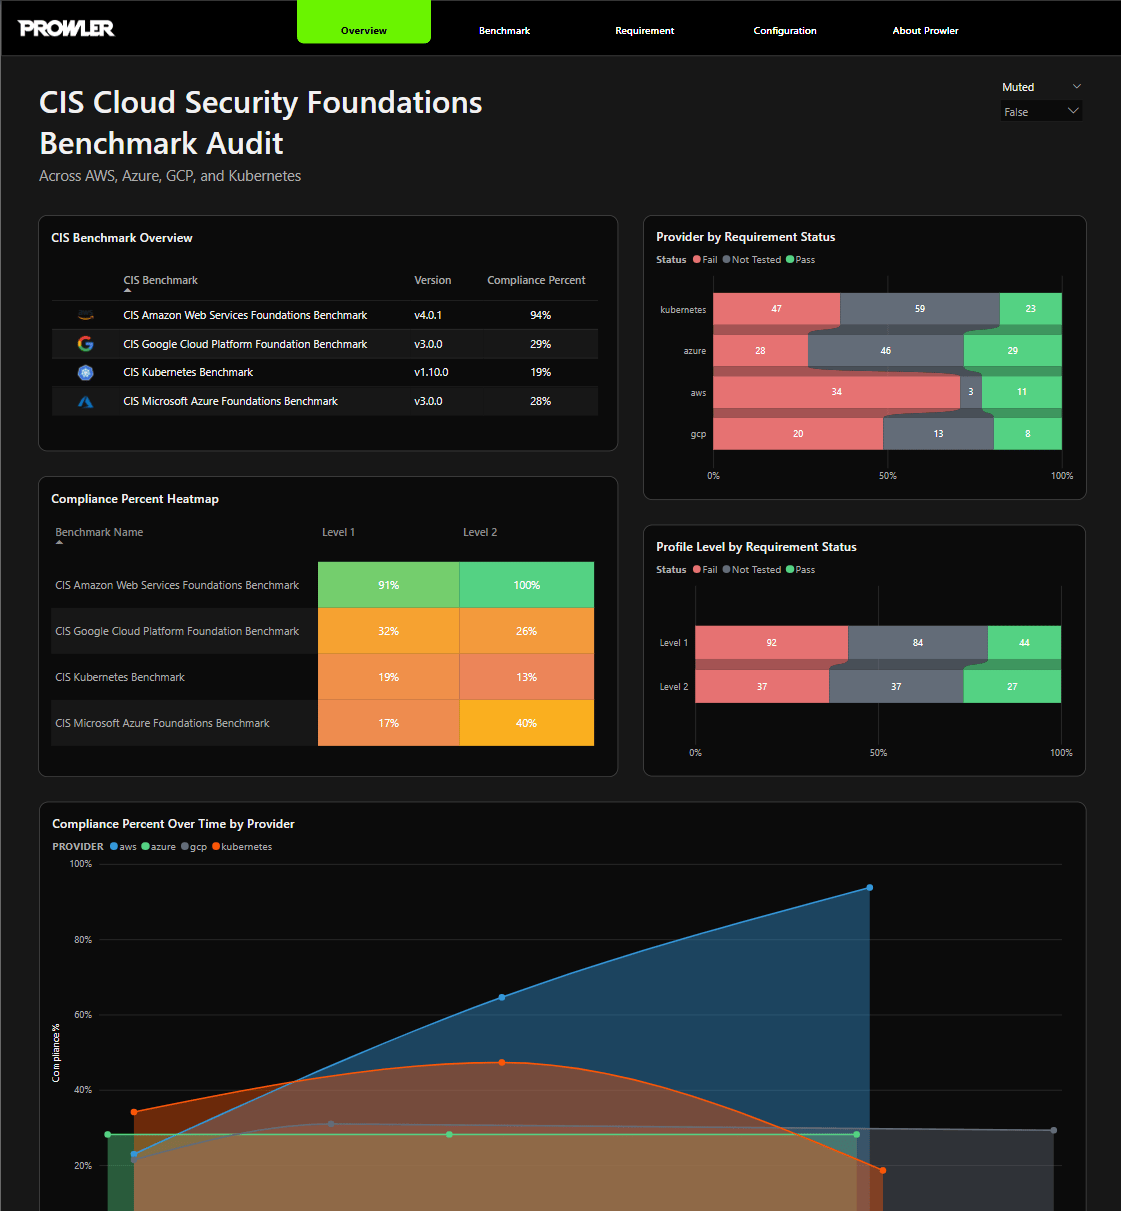
contrib/PowerBI/Multicloud CIS Benchmarks.
Prerequisites
The setup requires the following components:- Microsoft Power BI Desktop: free download from Microsoft.
- Prowler compliance CSV exports: produced by Prowler CLI or downloaded from Prowler Cloud or Prowler Local Server.
- Local directory: holds the CSV exports that the template ingests at load time.
Supported CIS Benchmarks
The template ships with predefined mappings for the following CIS Benchmark versions. Exports must match these versions for the dashboard to populate correctly:Setup
Step 1: Install Microsoft Power BI Desktop
Download and install Microsoft Power BI Desktop from the official Microsoft site. The template is opened with this application.Step 2: Generate Compliance CSV Exports
Compliance CSV exports can be generated through Prowler CLI or downloaded from Prowler Cloud and Prowler Local Server.Option A: Prowler CLI
Run a scan with the--compliance flag pointing to the appropriate CIS framework, for example:
output/compliance/ by default.
Option B: Prowler Cloud or Prowler Local Server
Open the Compliance section, select the desired CIS Benchmark, and download the CSV export.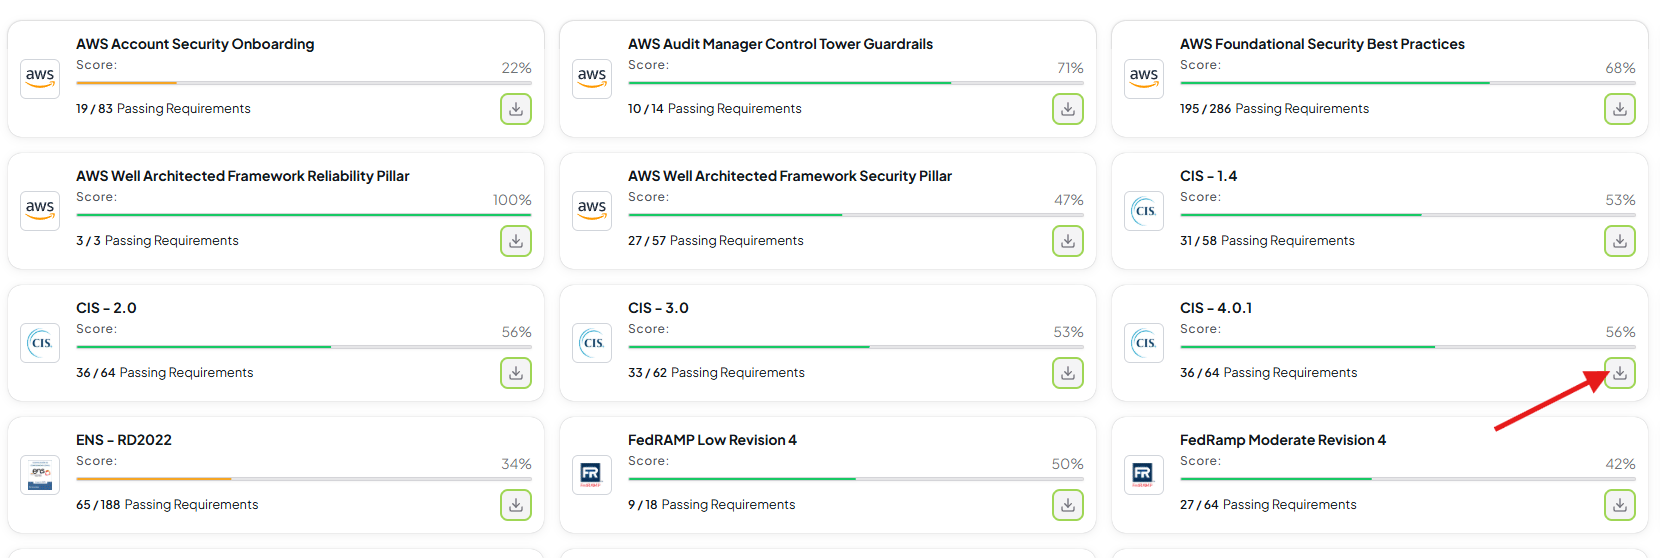
Step 3: Create a Local Directory for the Exports
Place every CSV export in a single local directory. The template parses filenames to detect the provider, so filenames must keep the provider keyword (aws, azure, gcp, or kubernetes).
Time-series visualizations such as “Compliance Percent Over Time” require multiple scans from different dates in the same directory.
Step 4: Open the Power BI Template
Download the template fileProwler Multicloud CIS Benchmarks.pbit and open it. Power BI Desktop prompts for the full filepath to the directory created in step 3.
Step 5: Provide the Directory Filepath
Enter the absolute filepath without quotation marks. The Windows “copy as path” feature wraps the path in quotation marks automatically; remove them before submitting.Step 6: Save the Report as a .pbix File
Once the filepath is submitted, the template ingests the CSV exports and renders the report. Save the populated report as a .pbix file for future use. Re-running the .pbit template generates a fresh report against an updated directory.
Validation
To confirm the CSV exports were ingested correctly, open the “Configuration” tab inside the report.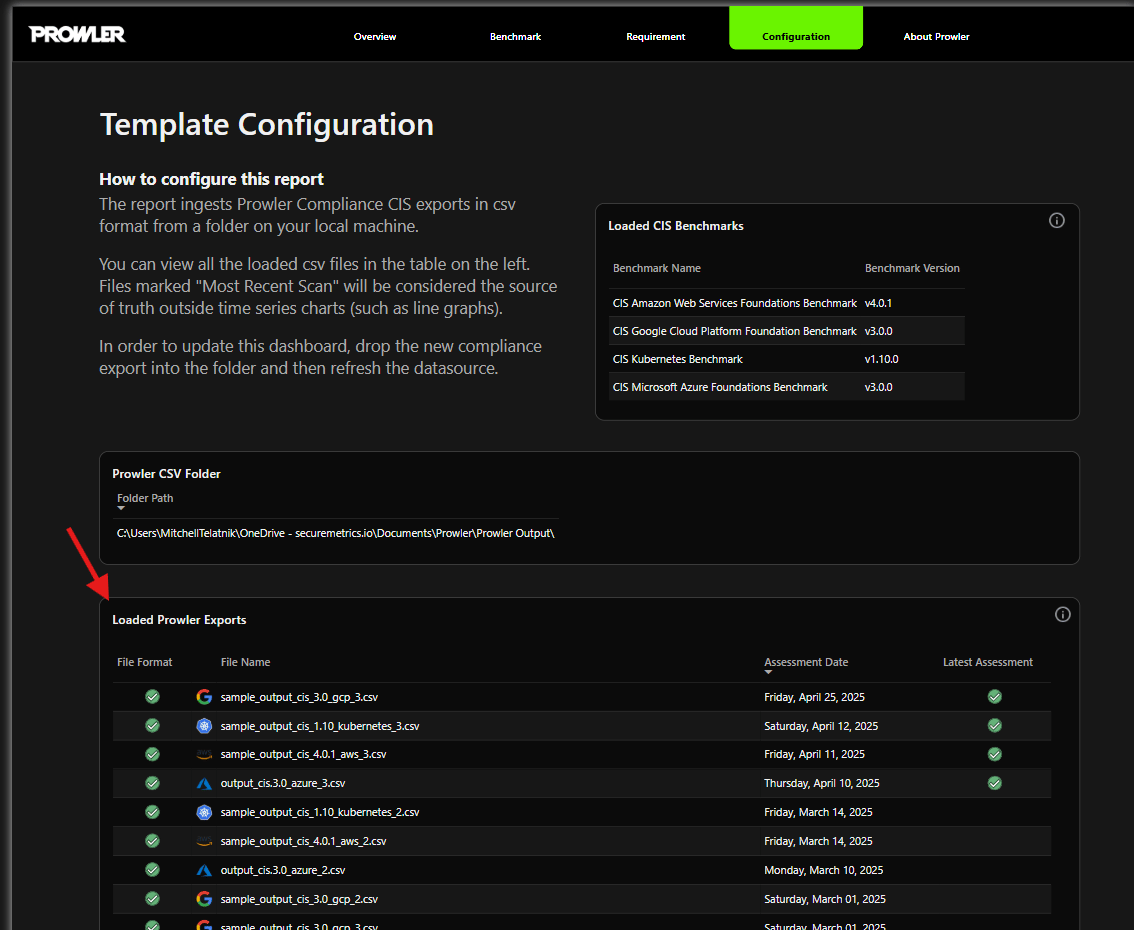
- Loaded CIS Benchmarks: lists the benchmarks and versions supported by the template. This table is defined by the template itself and is not editable. All benchmarks remain listed regardless of which provider exports were supplied.
- Prowler CSV Folder: displays the absolute path provided during template load.
- Loaded Prowler Exports: lists every CSV file detected in the directory. A green checkmark identifies the file used as the latest assessment for each provider and benchmark combination.
Report Sections
The report is organized into three navigable pages:Overview Page
The Overview page summarizes CIS Benchmark posture across every supported provider.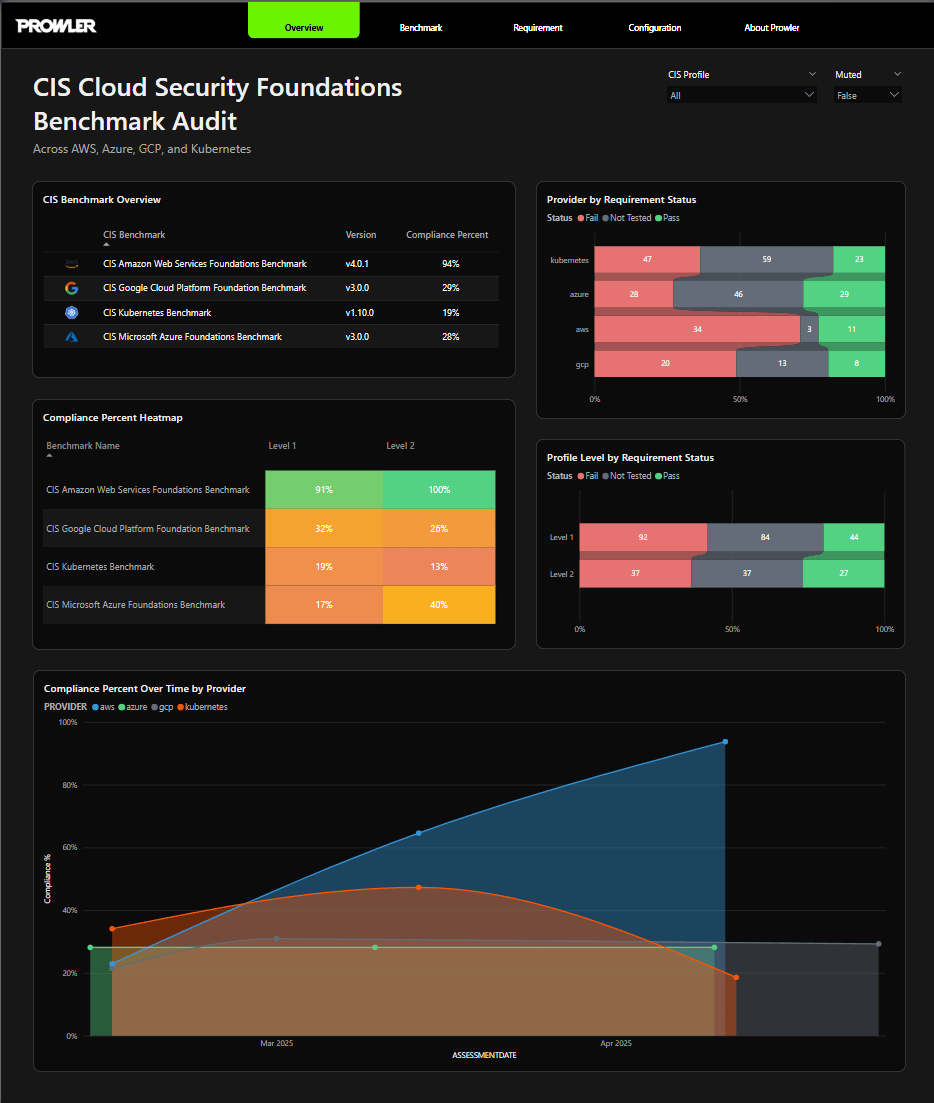
Benchmark Page
The Benchmark page focuses on a single CIS Benchmark. The benchmark, profile level, and region can be selected through dropdown filters.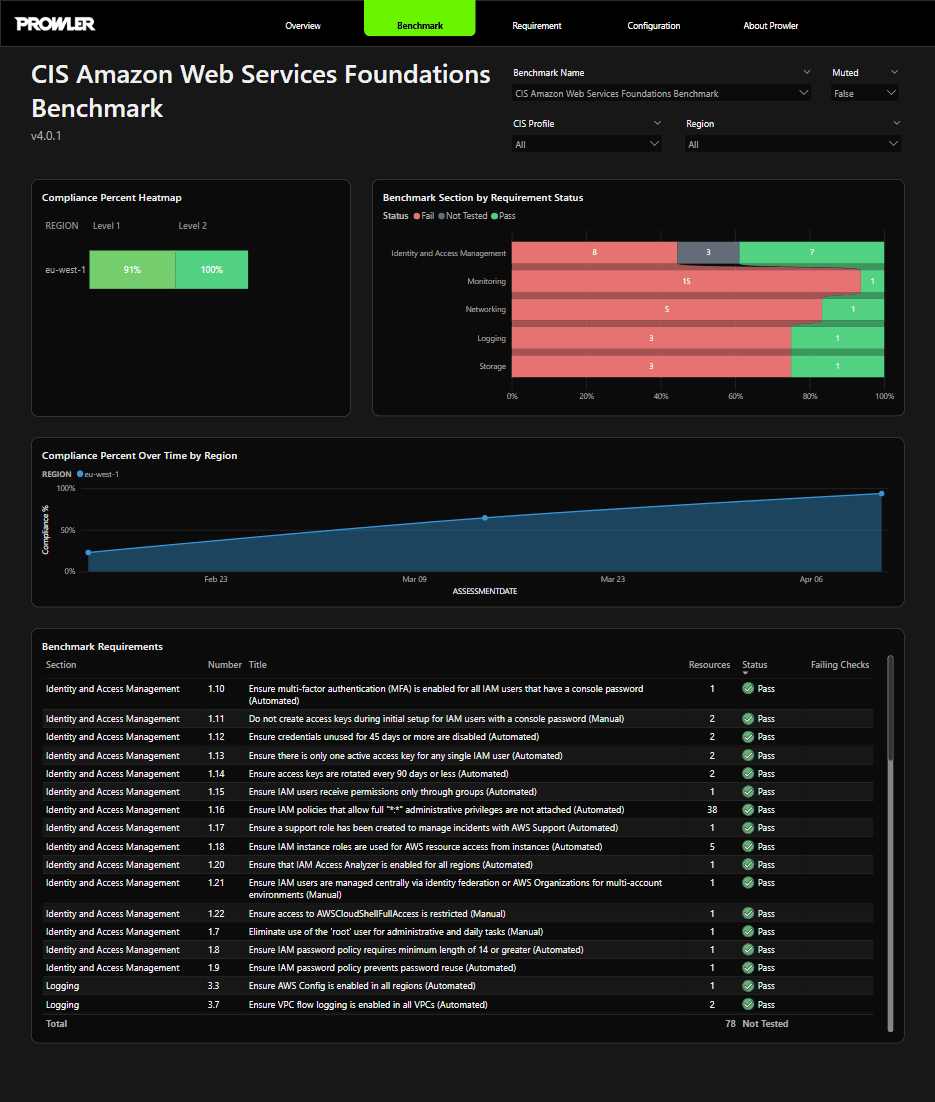
Requirement Page
The Requirement page is a drill-through view that exposes the full context of a single requirement. To populate the page, right-click a row in the “Benchmark Requirements” table on the Benchmark page and select “Drill through” > “Requirement”.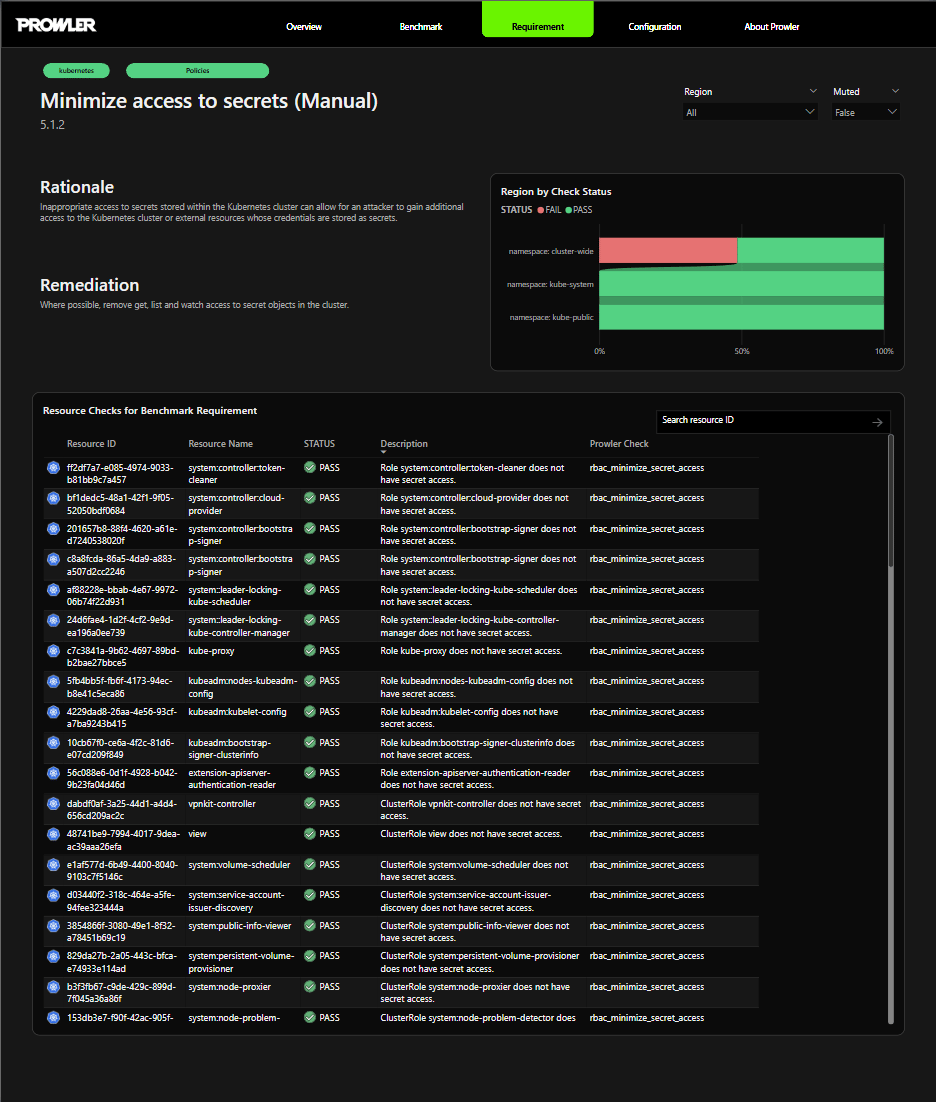
Walkthrough Video
A full walkthrough is available on YouTube:
Related Resources
Compliance Frameworks
Review the Compliance workflow across Prowler Cloud, Prowler Local Server, and Prowler CLI.
Prowler Dashboard
Explore the built-in local dashboard for Prowler CSV exports.